10.8 Bodegas Ysios
The Bodegas Ysios building, designed by Santiago Calatrava, is intended for the production, storage and distribution of wines. This figure shows a front view of the building’s south facade.
Bodegas Ysios’ south facade. Photograph by Luis Antonio Ortuño.
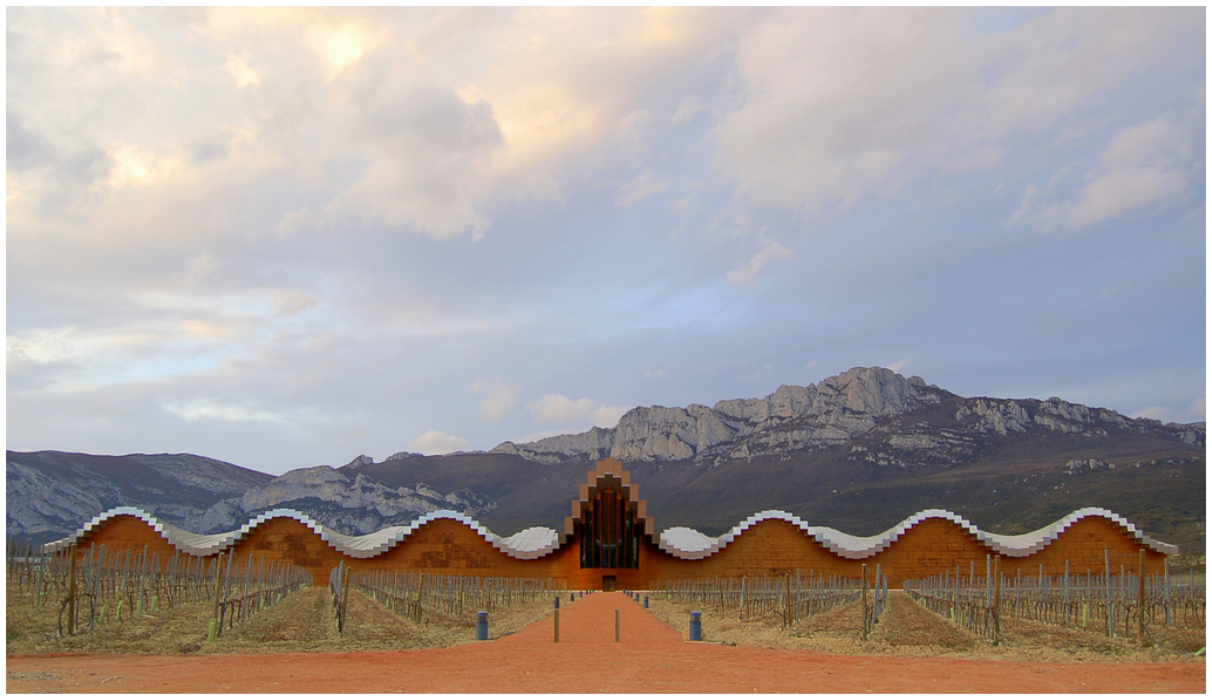
The building is 196 meters long and 26 meters wide. The two longitudinal walls have a sinusoidal shape whose top edge is also sinusoidal. The roof has the shape of a wave made of parallelepipeds that rest on the sinusoidal tops of the walls. Note that the parallelepipeds are generally not horizontal, since the two sinusoids of the tops of the walls have opposite phases with respect to one another. Two sinusoid phases are opposite if when one of the sinusoids reaches its maximum value the other reaches its minimum value, and vice versa. For this to happen, the difference between phases of the two sinusoids must be \(\pi\).
As can be seen in this figure, the central hump of the south facade, intended to accommodate the visitor entrance, is more prominent and higher than the rest of the building.
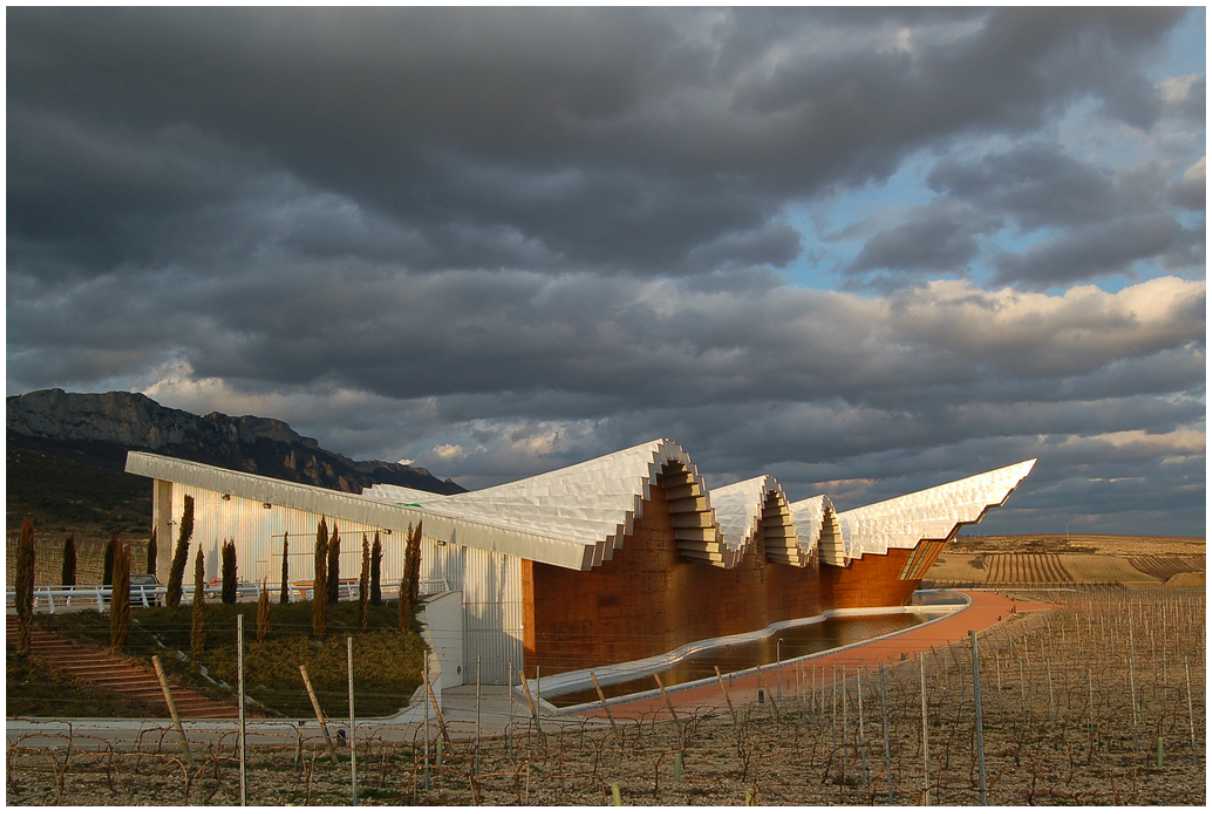
The roof parallelepipeds are made of aluminum, in contrast with the cedar wood that is used on the south facade. The north facade is made of concrete with some small openings for illumination. The east and west facades consist of corrugated aluminum sheets.
Bodegas Ysios’ southwest corner. Photograph by Koikile.
In this section we will address the modeling of the Bodegas Ysios’ south facade. A first approach could be to model this wall as a vertical extrusion of a sinusoid. Unfortunately, although this operation can properly model the lateral humps of the wall, it cannot do so for the central hump because, in this area, the wall moves away from the vertical.
A second approach could be the interpolation of regions, but this would only be achievable if we could shape the curves that delimit the wall. In addition to that, a large number of curves might be necessary in order to accurately represent the surface of the wall.
A third approach, more rigorous, consists in the mathematical description of the surface in question. This way, the required curves could be generated automatically. While it may be difficult to see at first glance that the wall of Bodegas Ysios can be modeled by a mathematical function, we will see that it is relatively simple to undertake this modeling through the composition and modification of simpler functions.
As a first approach, we can start by considering a wall obtained by the extrusion of a sinusoid. For simplicity, we will center the wall base at the origin, which implies that the central hump has its maximum amplitude at the origin. Since the sine amplitude is zero at the origin, it is preferable in this case to use the cosine, whose amplitude is maximum at the origin. The analysis of this building reveals that this cosine performs three cycles for each side of the central hump, whereby the period should range between \(-7\pi\) and \(+7\pi\). Admitting that this wall evolves along the \(XZ\) plane, we can start by experimenting the following expression:
surface_grid(map_division((x, z) -> xyz(x, cos(x), z),
-7*pi,
7*pi,
100,
0,
5,
10))
The expression above makes the \(x\) coordinate to vary freely, the \(y\) coordinate to be the \(x\) cosine, and the \(z\) coordinate to vary freely. As we can observe in this figure, the resulting surface is a good approximation of the lateral humps of the Bodegas Ysios’ south facade.
First approach to the modeling of the Bodegas Ysios’ south facade.

Let us now model the sinusoids at the top of the wall, where the roof’s parallelepipeds are supported. For this, we will simply make the \(z\) coordinate to oscillate in a cosinusoidal shape along the \(X\) axis, increasing the oscillation amplitude as we go up in \(z\). To make the wall’s base free from the influence of this cosinusoid, we will raise the cosine by one unit and use a reduced initial amplitude:
surface_grid(map_division((x, z) -> xyz(x, cos(x), z*(1+0.2*cos(x))),
-7*pi,
7*pi,
100,
0,
5,
10))
The result of evaluating the previous expression is shown in this figure.
Second approach to the modeling of the Bodegas Ysios’ south facade.

To model the increase in amplitude that the central hump has with the height, we can augment the cosine amplitude as the \(z\) height increases, by doing:
surface_grid(map_division((x, z) -> xyz(x, (z+3)*cos(x), z*(1+0.2*cos(x))),
-7*pi,
7*pi,
100,
0,
5,
10))
The result, seen in this figure, shows that the central hump is already correctly modeled, but it is necessary to avoid that this change also affects the lateral humps.
Third approach to the modeling of the Bodegas Ysios’ south facade.

For this, we need to make a combination of two different amplitude variations, one for the central hump of the wall, corresponding to half of a cosine cycle, i.e., a range of variation of \(x\) between \(-\frac{\pi}{2}\) and \(+\frac{\pi}{2}\), and another for everything else. We must consider that in order to compensate the slope difference caused by the increase of the \(y\) coordinate in the central hump we must also increase the variation amplitude in \(z\). Thus, we have:
surface_grid(map_division((x, z) -> xyz(x, -pi/2 <= x <= pi/2 ? (z+3)*0.8*cos(x) : cos(x), -pi/2 <= x <= pi/2 ? z*(1+0.4*cos(x)) : z*(1+0.2*cos(x))),
-7*pi,
7*pi,
100,
0,
5,
10))
The result of this change is shown in this figure.
Final modeling of the Bodegas Ysios’ south facade.

The final format of the function already gives a good approximation to the shape of the winery. This function can be seen as the mathematical representation of Calatrava’s ideas for the Bodegas Ysios’ south facade.
10.8.1 Exercises 55
10.8.1.1 Question 195
polygonal_prism([\(P_0\), \(P_1\), \(P_2\), \(P_3\)], \(d_x\))

10.8.1.2 Question 196
Define the function ysios_roof capable of creating roofs with the same style as the Bodegas Ysios’ roof, but with the roof shape being relatively arbitrary. To allow this arbitrariness, assume that the roof is defined by four arrays with the same number of points (represented by their coordinates). Moreover, the points that are in the same position in all four arrays are in the same plane parallel to the \(YZ\) plane, such as outlined in the following figure:

Using one point of each of the four arrays, use the function quadrangular_prism (explained in the previous exercise) to create a prism whose thickness \(d_x\) is equal to the distance between the planes defined by these points and by the next four points. The previous image shows two prisms constructed by this process.
10.8.1.3 Question 197
Define the function ysios_curve that, conveniently parametrized, can generate an array with one of the vertices of each of the successive prisms that constitute a roof in the Bodegas Ysios’ style. The following image was generated by the function ysios_roof using four invocations of the function ysios_curve as arguments.

10.8.1.4 Question 198
Identify a combination of parameters for the functions ysios_facade and ysios_curve that is capable of approximately reproducing the south facade and the roof of the Bodegas Ysios, as presented in the following image.

10.8.1.5 Question 199
The following image depicts a torus:

Deduce the parametric equations of the torus and define the Julia function torus, which creates a torus similar to one of the previous image from the center \(P\) of the torus, the major radius \(r_0\), the minor radius \(r_1\), and the number of intervals \(n\) and \(m\) to consider in each dimension.
10.8.1.6 Question 200
Redefine the previous function to generate a torus made of spheres like the one shown in the following image:

10.8.1.7 Question 201
The apple presented below can be described by the following parametric equations:
\[\left\{ \begin{aligned} x&=\cos u \cdot (4 + 3.8 \cos v)\\ y&=\sin u \cdot (4 + 3.8 \cos v)\\ z&=(\cos v + \sin v - 1) \cdot (1 + \sin v) \cdot \log(1 - \pi\cdot\frac{v}{10}) + 7.5 \sin v \end{aligned}\right.\]
We have that \(0\leq u\leq 2\pi\) and \(-\pi\leq v\leq\pi\).

Write a Julia expression that reproduces the previous apple.
10.8.1.8 Question 202
Consider the rose presented below:

This rose was generated from a set of parametric equations first described by Paul Nylander. Search for this equation and write a Julia expression that can generate the corresponding surface.