 |
Sequence of non-central t
curves Draws the pdf curves for a sequence of
non-central t distributions. |
|
|
| m |
(3 only !)
|
Number of ω's (one underlying each curve).
• |
| ω's |
% |
The ω's: their values (for the curves in the sequence,
preferably in increasing order). |
| L |
|
Lower specification limit. |
| n, α |
% |
Sample size and α (type I or producer's
risk). |
| t1, h,
t2 |
|
Left bound, step, right bound for t (horizontal axis in the
graph). |
| Show values |
|
Shows the coordinates of the curves. |
Draws the density (pdf) curves for the specified non-central
t distributions. The relation between t and Q is
Q = t ⁄ √n.
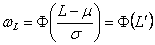
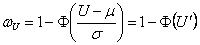
As ω (↑) increases (worse quality),
δ (↓) decreases, so the curve is moved to the
left, as noted below. The quality index, Q multiplied by
√n (ie., t) behaves as a non-central t
with parameters f = n − 1 and
 (or
(or
 ,
for U instead of L). ,
for U instead of L).
With
 (or (or
 ), it is, successively, ), it is, successively,
 (or (or
 ), ),
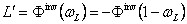 (or (or
 ), and for both cases ), and for both cases
 . Thus, as
ω increases, δ decreases. . Thus, as
ω increases, δ decreases. |
|
References:
• RESNIKOFF, George L., G. J. LIEBERMAN, 1957, "Tables of the
Non-Central t-Distribution", Stanford University Press, Stanford
(California), as cited in Duncan [1986].
• DUNCAN, Acheson J., 1986, "Quality Control and Industrial
Statistics", 5.th ed., Irwin, Homewood (Illinois) (previous editions 1952,
1959, 1965, 1974). |