Simulates, via Monte Carlo,
the distances from the source point to N random points
in a given rectangle, with base b and height h,
in order to find the distribution of the distance, d.
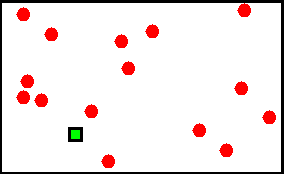
In the Figure, is shown a rectangle with the source point
(square) and N (here, a few) random points.
Plots the density function (pdf), f(d), and
the probability function (cdf), F(d),
for the distance, d, and computes its mean and standard-deviation.
(The user given point can be out of the rectangle.)
Other suggested data for (x, y):
(0.2, 0.2), (1, 0.2), (2.6, 0.2) |
 |

