Simulates, via Monte Carlo
(limited time), the total volume, V,
from several supplies, each with a given probability of effectiveness.
The probabilities (all) follow an "oblique"
(straight line, f = a v + b) distribution,
between given lower and upper (L, U) values
and slope.
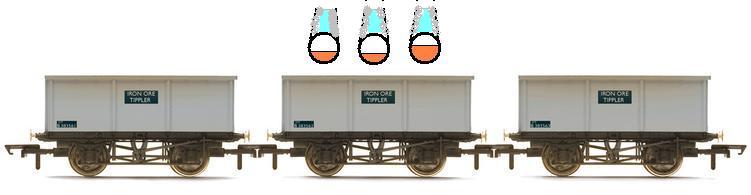
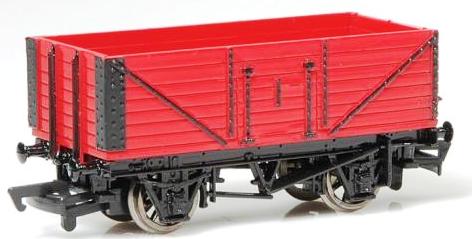
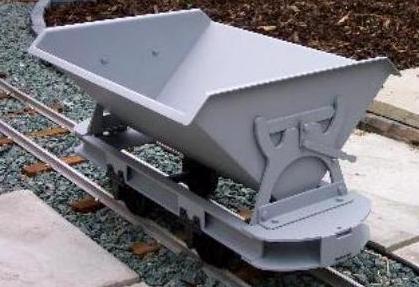
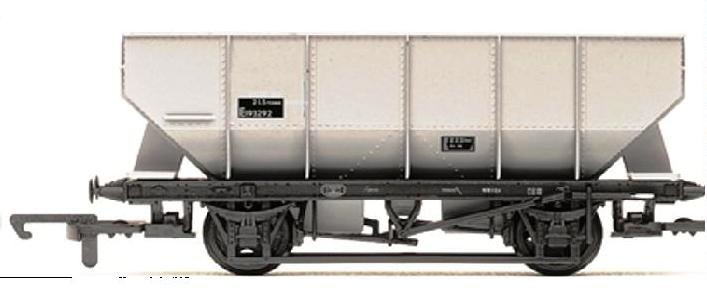
In the Figures, are shown: (right h. side) tank wagons
(or "open wagons") as used in factories for local transportation
(fr. wagonnet, pt vagoneta); and (below)
the base problem, with 3 supplies.
Plots the density function (pdf), f(v), and
the probability function (cdf), F(v),
for the total volume, and computes its mean and standard-deviation.
Other suggested data: prob. = .99 .99 .99 ; .8 .7 .6 . |
 |

