|
Mosaic of
points Computes statistics of random
2D points |
|
|
| Points |
(NB: n ≥ 3) |
Number of points in region. |
| Width, height |
|
Region width and height. |
| Statistic |
|
Statistic to be observed. |
| Trials (N), seed |
→
|
Monte Carlo trials, seed. |
| Simul. y-, x-axis bounds |
|
Simulation: axes bound in plot. |
| Plot points |
|
Simulation: n. of plot points. |
| Show values |
|
Show graph coordinates. |
From points in a given rectangle, computes,
relating to the distances between them:
average; standard deviation; minimum; maximum;
skewness; and kurtosis.
Skewness is illustrated in Fig. 1.
Shows the graphical behavior. |
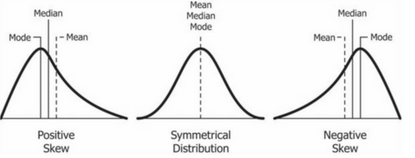 Fig. 1 |
|
|
References: |
Plate: Mosaic |
• Optimization (scipy.optimize), The SciPy community.
• 'minimize' (methods)
• CISTI'2027, 17–19 June (to be confirmed) 2027,
Porto (Portugal).
• 1875-06-28: Lebesgue, Henri Léon
(†1941-07-26, 66 yrs.). |

